来了来了 它来了
1 | docker start www |
微信发视频不压缩
- 发送“文件” - 手机相册 小于1G
- 我 收藏 点击左下角的照片图标
- 上传到网盘
- 蓝牙 隔空投送
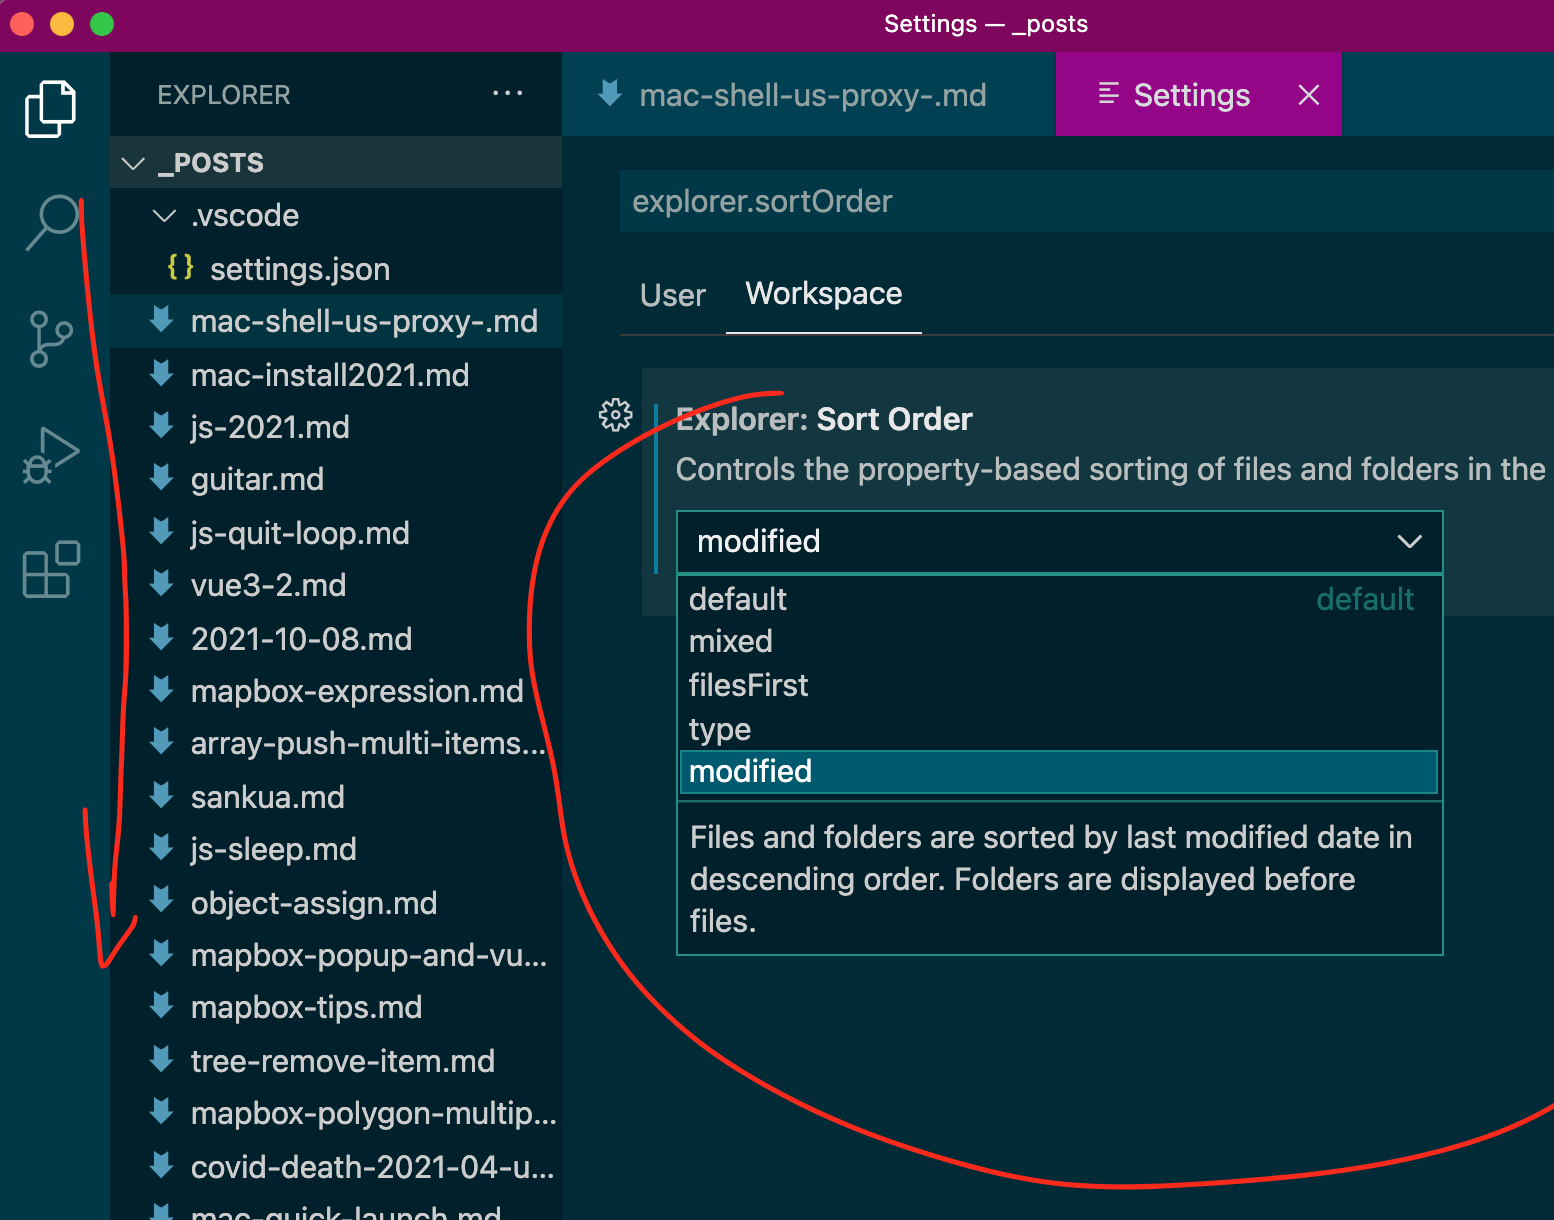
1 | setfile -d '6/2/2022 12:00' 福山.md |
或者
1 | touch -t 202206021200 福山.md |
参考:
open -n /Applications/WeChat.app/Contents/MacOS/WeChat
EADGBE
6弦 夹 2品
4、5弦不调
3弦 夹 1品
2、1弦 夹 2品
6弦降1个全音
4、5弦不调
3弦降半个音
2、1弦降1个全音
花
奇迹的山
少年的梦 https://www.bilibili.com/video/BV1x4411U7Mm
3.蒲公英 dandelion
4.November
5.绊 - Ties of mind
6.Truth 这不是 open D!!!!
7.雨降る窓辺で
8.Yesterday Once More
9.春、来る
10.少年の梦
11.All together
以上都是岸部真明的作品
12.涙そうそう(泪光闪闪)-谷本光 这首相对比较难
则Time travel的特殊调弦是 1=D,2=A,3=G,4=D,5=G,6=C
岸部 - time travel 时间旅行
流行的云
押尾 - Promise
GIN - 願望的櫻花 愿樱
岸部真明 - Black Baccara
岸部真明 - 流星
岸部真明 - 朝の光を感して(感受清晨的阳光)https://www.bilibili.com/video/BV16a411k7W8/
中川砂仁 - hua lien
中川砂仁 - 風の伯爵夫人
走音 - you are not alone
走音 - 蝶戀花
Rusi - 菊花台
convertible
El condor pasa 押尾桑(G调)
标准调弦是 1=E,2=B,3=G,4=D,5=A,6=E
1 | epgis.workerUrl = window.URL.createObjectURL(new Blob([workerBundleString],{ |
1 | getImageData: function(t) { |
1 | var V, F, O = { |
1 | var s = this._UAParser.getDevice().type; |
1 | javascript:var%20currentsite%3Ddocument.querySelector(%22meta%5Bproperty%3D'al%3Aandroid%3Aapp_name'%5D%22)%3Fdocument.querySelector(%22meta%5Bproperty%3D'al%3Aandroid%3Aapp_name'%5D%22).content%3Awindow.location.href%3Bfunction%20isPage(b)%7Bconsole.log(b%2B%22%20%22%2Bcurrentsite.includes(b))%3Breturn%20currentsite.includes(b)%7Dfunction%20process(b)%7Bvar%20a%3Db%3BisPage(%22NYTimes%22)%26%26(document.querySelector(%22html%22).innerHTML%3Da)%3BisPage(%22Medium%22)%26%26(a%3Db.replace(%2F%3C%5C%2F%3Fnoscript%3E%2Fg%2C%22%22)%2Cdocument.querySelector(%22html%22).innerHTML%3Da)%3Bif(isPage(%22Bloomberg%22)%7C%7CisPage(%22businessinsider%22))a%3Ddocument.createElement(%22html%22)%2Ca.innerHTML%3Db%2Ca.querySelectorAll(%22script%22).forEach(function(a)%7Breturn%20a.outerHTML%3D%22%22%7D)%2Ca%3Da.outerHTML%2Cdocument.open()%2Cdocument.write(a)%2Cdocument.close()%3BisPage(%22businessinsider%22)%26%26(a%3Ddocument.createElement(%22html%22)%2Ca.innerHTML%3Db%2Ca.querySelectorAll(%22script%22).forEach(function(a)%7Breturn%20a.outerHTML%3D%22%22%7D)%2Ca.querySelectorAll(%22figure%22).forEach(function(a)%7Ba.innerHTML%3Da.querySelector(%22noscript%22).innerHTML%7D)%2Ca%3Da.outerHTML%2Cdocument.open()%2Cdocument.write(a)%2Cdocument.close())%7Dfetch(window.location.href%2C%7Bcredentials%3A%22omit%22%2Credirect%3A%22follow%22%2Cmode%3A%22no-cors%22%7D).then(function(b)%7Breturn%20b.text()%7D).then(function(b)%7Bprocess(b)%7D)%3Bvoid+0 |
1 | var currentsite=document.querySelector("meta[property='al:android:app_name']")?document.querySelector("meta[property='al:android:app_name']").content:window.location.href;function isPage(b){console.log(b+" "+currentsite.includes(b));return currentsite.includes(b)}function process(b){var a=b;isPage("NYTimes")&&(document.querySelector("html").innerHTML=a);isPage("Medium")&&(a=b.replace(/<\/?noscript>/g,""),document.querySelector("html").innerHTML=a);if(isPage("Bloomberg")||isPage("businessinsider"))a=document.createElement("html"),a.innerHTML=b,a.querySelectorAll("script").forEach(function(a){return a.outerHTML=""}),a=a.outerHTML,document.open(),document.write(a),document.close();isPage("businessinsider")&&(a=document.createElement("html"),a.innerHTML=b,a.querySelectorAll("script").forEach(function(a){return a.outerHTML=""}),a.querySelectorAll("figure").forEach(function(a){a.innerHTML=a.querySelector("noscript").innerHTML}),a=a.outerHTML,document.open(),document.write(a),document.close())}fetch(window.location.href,{credentials:"omit",redirect:"follow",mode:"no-cors"}).then(function(b){return b.text()}).then(function(b){process(b)});void+0 |
via https://www.zhangxinxu.com/wordpress/2020/11/css-mix-blend-mode-filter-dark-theme/
1 | @media (prefers-color-scheme: dark) { |
js 检测
1 | window.matchMedia("(prefers-color-scheme: dark)").matches; |
js drag
查看
1 | defaults read -g com.apple.mouse.scaling |
设置 (推荐 8 - 10)
1 | defaults write -g com.apple.mouse.scaling 8 |
via https://docs.mapbox.com/mapbox-gl-js/style-spec/layers/#layout-line-line-miter-limit
Layout property. Optional enum. One of “butt”, “round”, “square”. Defaults to “butt”.
1 | test.map.setLayoutProperty('layer_goudao','line-cap','round') |
默认是 miter
Layout property. Optional enum. One of “bevel”, “round”, “miter”. Defaults to “miter”.
1 | test.map.setLayoutProperty('layer_goudao','line-join','round') |
拐弯:修饰 尖角
Layout property. Optional number. Defaults to 2. Requires line-join to be “miter”. Supports interpolateexpressions.
Used to automatically convert miter joins to bevel joins for sharp angles.
如果 line-join 是 “round” 的情况下 浅角(尖角的相反)
拐弯:修饰 浅角
Layout property. Optional number. Defaults to 1.05. Requires line-join to be “round”. Supports interpolateexpressions.
Used to automatically convert round joins to miter joins for shallow angles.
宽度必须偶数
Paint property. Optional resolvedImage. Transitionable.
Name of image in sprite to use for drawing image lines. For seamless patterns, image width must be a factor of two (2, 4, 8, …, 512). Note that zoom-dependent expressions will be evaluated only at integer zoom levels.
(线自己的)左右偏移(像素)
Paint property.
偏移
Paint property. Optional array of numbers. Units in pixels. Defaults to [0,0]. Supports interpolateexpressions. Transitionable.
1 | ~/Library/Preferences/ – (当前用户设置的进程) |
1 | # 查看anydesk服务名 |
默认是 1087(不是 1086 也不是 1089)
1 | export http_proxy='http://127.0.0.1:1087' |
测试地址
1 | curl https://www.bbc.com/ |
1 | alias p10='export http_proxy="http://127.0.0.1:1087";export https_proxy=$http_proxy;echo -e 已开启代理' |
或者
1 | function proxy(){ |
export http_proxy=这里不能有空格’http://127.0.0.1:1087'
1 | \e |
1 | red=`tput setaf 1` |
1 | echo "$(tput setaf 1)Red text $(tput setab 7)and white background$(tput sgr 0)" |
tput setab [1-7] # Set the background colour using ANSI escape
tput setaf [1-7] # Set the foreground colour using ANSI escape
Num Colour #define R G B
0 black COLOR_BLACK 0,0,0
1 red COLOR_RED 1,0,0
2 green COLOR_GREEN 0,1,0
3 yellow COLOR_YELLOW 1,1,0
4 blue COLOR_BLUE 0,0,1
5 magenta COLOR_MAGENTA 1,0,1
6 cyan COLOR_CYAN 0,1,1
7 white COLOR_WHITE 1,1,1
1 | ,--, .-. .-. .---. .---. .-. .-..-. .-. .--. .-. .-. ,--, |
Command+Shift+p 输入 shell
选择 install code command in path
在终端打开项目
1 | code 目录名 |
其实是放了链接
1 | /usr/local/bin |
查看
1 | which code |
1 | open -a "Visual Studio Code" |
https://dockyard.com/blog/2019/07/15/follow-these-steps-to-enable-vs-code-color-customization
编辑 .vscode/settings.json
1 | { |
Open Terminal
Run touch ~/.gitignore_global to create a global .gitignore file in your home directory
Run open ~/.gitignore_global to open the file
Add .vscode/ to the file
Run git config –global core.excludesfile ~/.gitignore_global